Notice: The number of participants in our project has finally reached the point that we have had to completely reorganize our Groups. This will not be much of a problem for those of you not familiar with the old system, but may be confusing to anyone who had become familiar with it. Please see the endnote for a conversion table.[i]
The value of the Ewing Surname Y-DNA Project depends on correlating the conventional genealogies of participants with their Y-DNA results. [For an introductory discussion of Y-DNA testing in genealogy, have a look at David Ewing's Y-DNA Project Articles.] On this website, we report both conventional genealogies and Y-DNA results, but our main goal is to display the correlation between them as clearly as possible, and our hope is that this will foster more focused and productive conventional genealogical research. We have divided our participants into Groups in a way that is meant to show both “DNA relatedness” and conventional relatedness. Group names consist of a numeral followed by a lower case letter. Loosely, the numeral refers to the DNA results and the letter to conventional genealogy.
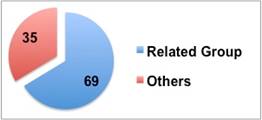 Perhaps the most striking finding of the project so far is that over two
thirds of our participants have DNA results so similar that we
have concluded that they are related to one another within a
genealogical time frame. Admittedly, “genealogical time frame”
is rather vague language, but the probabilistic nature of DNA
evidence requires us to be a little vague. We think that all of
the men in this group had a common Ewing ancestor who lived
about four hundred years ago, probably in the Lowlands of
Scotland in an area still sometimes called Strathclyde, not far
from the bonnie, bonnie banks of Loch Lomond of legend
and song. We have conventional genealogical data on a few
good-sized Ewing families and several more families with a few
representatives each that all fall within this large group. The
earliest known progenitors of these families were born in the
mid-seventeenth century, sometime after their common ancestor
lived. At least three of the families lived near one another in
county Donegal, Ireland, and though we can tell that they are
related on the basis of the DNA results of their descendants in
our project, we do not have conventional proof of their
genealogical connections.[ii]
Perhaps the most striking finding of the project so far is that over two
thirds of our participants have DNA results so similar that we
have concluded that they are related to one another within a
genealogical time frame. Admittedly, “genealogical time frame”
is rather vague language, but the probabilistic nature of DNA
evidence requires us to be a little vague. We think that all of
the men in this group had a common Ewing ancestor who lived
about four hundred years ago, probably in the Lowlands of
Scotland in an area still sometimes called Strathclyde, not far
from the bonnie, bonnie banks of Loch Lomond of legend
and song. We have conventional genealogical data on a few
good-sized Ewing families and several more families with a few
representatives each that all fall within this large group. The
earliest known progenitors of these families were born in the
mid-seventeenth century, sometime after their common ancestor
lived. At least three of the families lived near one another in
county Donegal, Ireland, and though we can tell that they are
related on the basis of the DNA results of their descendants in
our project, we do not have conventional proof of their
genealogical connections.[ii]
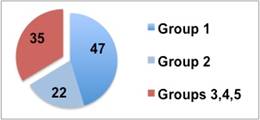 To facilitate discussion of our results, we have divided project
participants into five Groups numbered 1 through 5 on the basis
of Y-DNA results that are in some sense similar.[iii]
The best way to see the relative genetic distances between and
within the Groups is to have a look at
Network Diagram - Overview. The Ewings in the large cluster are so closely related that they are
piled on top of one another in
the
overview diagram and you will need to have a look
at
Network Diagram - Detail
to see a graphical display of the genetic relationships among them. There
is a fairly clear division of the large closely related group
based on one marker, DYS 391. There is nothing intrinsically
special about this marker, but it happens that about a third of
the men in the large closely related group have DYS 391 = 10,
and the others have DYS 391 = 11. We think that the mutation
that created the difference at this marker must have happened
quite a long time ago, perhaps not so long after the common
ancestor of the two groups lived. We have put our project
participants with DYS 391 = 11 in Group 1 and our participants
with DYS 391 = 10 in Group 2. Keep in mind as you look at the
bar graph below that the men in Groups 1 & 2 are more closely
related to one another than the men within any of the other
Groups. Indeed, Groups 5a & 5b are less closely related to one
another than all of the men in Groups 1, 2, 3 and 4 are related
to one another. So far, the only man in Group 5* is in
Haplogroup G, which is even more distantly related. This
Haplogroup occurs in Britain, but only accounts for a percent or
two of haplotypes there. It is thought to have originated in
Central Asia, and maybe to have come to Britain 2000 years ago
with the Roman legions, which included soldiers from the far
reaches of the Roman Empire.
To facilitate discussion of our results, we have divided project
participants into five Groups numbered 1 through 5 on the basis
of Y-DNA results that are in some sense similar.[iii]
The best way to see the relative genetic distances between and
within the Groups is to have a look at
Network Diagram - Overview. The Ewings in the large cluster are so closely related that they are
piled on top of one another in
the
overview diagram and you will need to have a look
at
Network Diagram - Detail
to see a graphical display of the genetic relationships among them. There
is a fairly clear division of the large closely related group
based on one marker, DYS 391. There is nothing intrinsically
special about this marker, but it happens that about a third of
the men in the large closely related group have DYS 391 = 10,
and the others have DYS 391 = 11. We think that the mutation
that created the difference at this marker must have happened
quite a long time ago, perhaps not so long after the common
ancestor of the two groups lived. We have put our project
participants with DYS 391 = 11 in Group 1 and our participants
with DYS 391 = 10 in Group 2. Keep in mind as you look at the
bar graph below that the men in Groups 1 & 2 are more closely
related to one another than the men within any of the other
Groups. Indeed, Groups 5a & 5b are less closely related to one
another than all of the men in Groups 1, 2, 3 and 4 are related
to one another. So far, the only man in Group 5* is in
Haplogroup G, which is even more distantly related. This
Haplogroup occurs in Britain, but only accounts for a percent or
two of haplotypes there. It is thought to have originated in
Central Asia, and maybe to have come to Britain 2000 years ago
with the Roman legions, which included soldiers from the far
reaches of the Roman Empire.
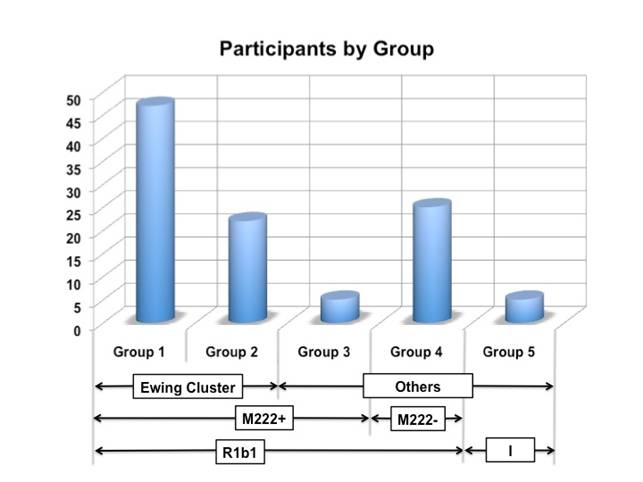
So look again. Groups 1 & 2 are in the Ewing cluster, while Groups 3, 4 & 5 are not. Even though Group 3 is not in the Ewing cluster, it is still M222+. Groups 1, 2, 3 & 4 are all in Haplogroup R1b1, but Group 4 is M222-. Group 5 will include all haplogroups except Haplogroup R, but so far, it has five men in Haplogroup I and one in Haplogroup G. Look again at Network Diagram - Overview, which will give you an idea of the relative genetic distances involved within and between the Groups. This diagram is difficult to prepare and though it is accurate as far as it goes, it is not completely up to date. For example, it does not yet include our Haplogroup G participant, who is the only member of Group 5* so far.
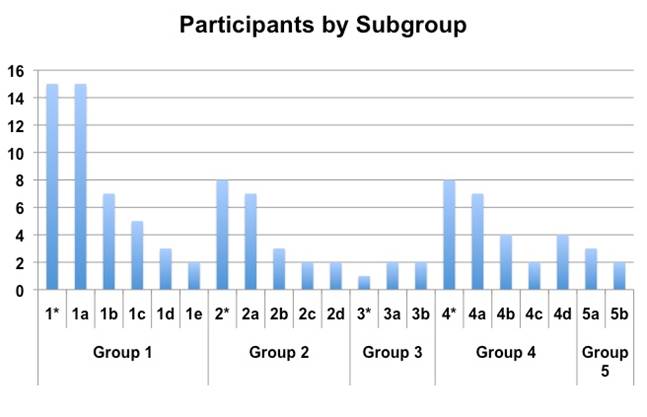
These five main Groups are defined strictly on the basis of the Y-DNA results of the participants in each of the Groups, and the Groups are further subdivided based on the conventional genealogy of the participants. Each known conventional kindred of two or more participants is designated with a different lower case letter. So, for example, Group 1a consists of the descendants of John Ewing of Carnashannagh; Group 1b consists of the descendants of James Ewing of Inch; Group 1c consists of the descendants of James Ewing b1720/25, and so on. These Groups (or subgroups, if you like) are so closely related that we cannot distinguish them on the basis of their Y-DNA results. Indeed, there are men in each of these Groups that have Y-DNA that exactly matches the Ewing modal haplotype, so they are at genetic distance zero from one another, even though they are in different subgroups. Similarly, Group 2a consists of the descendants of “William?”, Group 2b consists of a group Karen Avery considers to be descendants of Alexander b. ca1731, etc. Again, the subgroups of Group 2 cannot be reliably distinguished from one another on the basis of DNA results alone, and some men with identical results are in different subgroups. In each of the five main Groups there also men who do not know their genealogical connection with any of the others; we have put them into subgroups designated by the Group number followed by an asterisk. Men in Group 1 who do not know their conventional genealogic connection with the others are in subgroup 1*; men in Group 2 who do not know their conventional genealogic connection with the others are in subgroup 2*, etc.
Subgroup Descriptions
- Group 1* consists of men whose DNA results do not differ significantly from the others in Group 1, but we do not know their conventional genealogic connection with the others or with one another.
- Group 1a consists of the descendants of John Ewing of Carnashannagh, Parish of Fahan, County Donegal, Ireland, whose descendants appear in Fife, Ch 11. An argument could be made that there is insufficient conventional genealogic evidence that Pocahontas James Ewing b1722 is in fact the son of John Ewing of Carnashannagh, and that his seven descendants who are included in this Group should be broken out into their own Group. A Relationship Diagram is at
http://dl.getdropbox.com/u/431003/Group1aRelationshipDiagram.pdf.
- Group 1b consists of the descendants of James Ewing of Inch Island in Lough Swilly, County Donegal, Ireland, whose descendants appear in Fife, Ch 41, and elsewhere in Fife. A Relationship Diagram is at
http://dl.getdropbox.com/u/431003/Group1bRelationshipDiagram.pdf.
- Group 1c consists of the descendants of James Ewing m. Maria Shellenberger, whose descendants appear in Fife, Ch 32. He is thought to have been born in 1720-25 or so, perhaps in Pennsylvania, married in Lebanon County, Pennsylvania, had most of his children in Washington County, Maryland and finally settled in Wayne County, Ohio sometime after 1805. A Relationship Diagram is at
http://dl.getdropbox.com/u/431003/Group1cRelationshipDiagram.pdf.
- Group 1d consists of the descendants of Joshua Ewing b1793 in Kentucky and d1846 in Caldwell Parish, Louisiana. A Relationship Diagram is at
http://dl.getdropbox.com/u/431003/Group1dRelationshipDiagram.pdf.
- Group 1e consists of two men named Ewin, who are descendants of William Ewing b. ca1750 maybe in county Sligo, Ireland. A Relationship Diagram is at
http://dl.getdropbox.com/u/431003/Group1eRelationshipDiagram.pdf.
- Group 1f consists of the descendants of William Ewing 1749-1814, married Margaret Patterson and lived in Little Britain Township, Pennsylvania. A Relationship Diagram is at
http://dl.getdropbox.com/u/431003/Group1fRelationshipDiagram.pdf.
- Group 2* consists of men whose DNA results do not differ significantly from the others in Group 2, but we do not know their conventional genealogic connection with the others or with one another.
- Group 2a consists of the descendants of Nathaniel Ewing and his half-brothers. We are not certain what the name of their father was, but Fife quotes a letter of one of his descendants saying “I believe his name was William” so we sometimes call him that and sometimes we just call him “William?”. We don't have proof certain, but we believe that William? lived in Londonderry, now in Northern Ireland, within easy walking distance of Inch and Carnashannagh. You can read about him and his descendants in Y-DNA Article 4. His descendants appear in several chapters of Fife, but start with Fife, Ch 24. A Relationship Diagram is at
http://dl.getdropbox.com/u/431003/Group2aRelationshipDiagram.pdf.
- Group 2b consists of two of the descendants of John Ewing b1763 (RC & EN) and EG, who Karen Avery believes all are descended from Alexander Ewing b. ca1731. A Relationship Diagram is at
http://dl.getdropbox.com/u/431003/Group2bRelationshipDiagram.pdf.
- Group 2c consists of the descendants of William Ewing b. ca1709. This is the line of Margaret Ewing Fife and is discussed in Fife Ch 7, 13, 34, 38 and 43. A Relationship Diagram is at
http://dl.getdropbox.com/u/431003/Group2cRelationshipDiagram.pdf.
- Group 2d consists of men who Karen Avery considers to be the descendants of Henry Ewing b1740. Though he does not appear in Fife, Karen believes one of his sons is William Ewing b1762, who is the subject of Fife, Ch 21. A Relationship Diagram is at
http://dl.getdropbox.com/u/431003/Group2dRelationshipDiagram.pdf.
- Group 3* will consist of men who are in R:M222 but are too distant from the Ewing modal and from the men in Groups 3a & 3b to be considered related to any of them within a genealogical time frame. So far, this group has no members. Perhaps we should mention also that the two Group 3 conventional kindreds (3a & 3b) have DNA dissimilar enough that they also cannot be related to one another.
-
Group 3a consists of the descendants of Jacob Ewing (1783-1851), whose
lineage does not appear in Fife. He may have been born in
Maryland. The earliest civil record that has been found is
the record of his marriage to Susannah Ebaugh in 1812 in
Baltimore County, Maryland, and they appear in the census
records there from 1820-1850. A Relationship Diagram is at
http://dl.getdropbox.com/u/431003/Group3aRelationshipDiagram.pdf. - Group 3b consists of two Ewing men who are plainly related to one another but not to the other men in the project. Interestingly, their DNA pattern is a close match for the pattern seen in the McLaughlins of Donegal. A Relationship Diagram is at
http://dl.getdropbox.com/u/431003/Group3bRelationshipDiagram.pdf.
- Group 4* consists of a heterogeneous group of men that are in R1b1b2 and are not M222+, and are therefore not in R:M222. Please notice that Group 4 is much more genetically diverse than the first three groups. All of the men in Groups 1, 2 & 3 are more closely related to one another than the men in Group 4.
- Group 4a is a cluster of six men in Haplogroup R1b1b2 that appear closely related to one another based on their DNA results. Three of them have conventional genealogy documenting their descent from William Ewing b. c1730 and d. 1774 in Conemaugh Township, Indiana County, Pennsylvania, whose line does not appear in Fife. Their conventional genealogical relationship with the remaining three is not known, but they form a genetic cluster suggesting that they may have a relatively recent common ancestor. The men in this cluster are not related to any of the other men in the project in a genealogical timeframe. A Relationship Diagram is at
http://dl.getdropbox.com/u/431003/Group4aRelationshipDiagram.pdf.
- Group 4b consists of known third cousins SL & ME, descendants of Charles Ewing b1836 in Illinois and d1877 in Wayne County, Illinois and PA, who is not known to be related to them, but has a very similar DNA pattern. PA lives in Scotland. His earliest known ancestors come from around Glasgow and never immigrated to America. This Group falls within McEwan’s R1bSTR43-Scots cluster. McE may also be in the STR43 cluster, but he is not nearly as closely related as the other three, so we have left him in Group 4*. A Relationship Diagram is at
http://dl.getdropbox.com/u/431003/Group4bRelationshipDiagram.pdf.
- Group 4c consists of three men who believed themselves to be descendants of John Ewing b1695, the subject of Fife, Ch 31. RL2 & PT are known to be sixth cousins of one another and their DNA results are entirely consistent with that, but Fife thinks John Ewing b1695 was one of the sons of William? and the DNA of RL2 & PT is nothing like the DNA of the other descendants of William?, so there must be a mistake somewhere. WD matches the other two men in this group very closely and I am told that he is known to be their relative, but we do not have his lineage information, yet. A Relationship Diagram is at
http://dl.getdropbox.com/u/431003/Group4cRelationshipDiagram.pdf.
- Group 4d consists of the descendants of James Ewing of Hunterdon County, New Jersey, who is the subject of Fife, Ch 7 & 13. JR is descended from John Ewing b. ca1739, one of the grandsons of this man, through Thomas b1782 who appears on Fife p359. Fife thought that her ancestor William b. ca1768 (he and his descendants are discussed at length in her Chapters 34, 38 & 43) was the older brother of Thomas b1782, also the son of John b. ca1739, but the Y-DNA evidence has shown that this cannot be so. Project participants who are the descendants of William b. ca1768 have Y-DNA completely unlike those in 4d, and they appear in Group 2c. A Relationship Diagram is at
http://dl.getdropbox.com/u/431003/Group4dRelationshipDiagram.pdf.
- Group 5* has only one member so far, and he happens to be in Haplogroup G, but this group will consist of project participants in any haplogroup except for Haplogroup R that do not fall within any of the other Group 5 subgroups.
- Group 5a consists of three descendants of William Ewing of Rockingham County, Virginia (c1696-1794), known relatives who have very similar haplotypes. Two of them spell their names "Ewin" and the third "Ewing." This line appears in Fife, Ch 32. None of them have had deep clade SNP testing, but an unusual STR value (null DYS425) in the two of them tested for this essentially confirms that they are in Haplogroup I2b1a, a very ancient British type. A Relationship Diagram is at
http://dl.getdropbox.com/u/431003/Group5aRelationshipDiagram.pdf.
- Group 5b consists of two men in a completely different branch of Haplogroup I, one of them a Ewan and the other a Ewing. We have only 12-marker data on the Ewan in this group and we do not have information on his lineage, so he does not appear in the Network or Relationship Diagrams. Strictly speaking, we should call this Group 5*, because we do not have conventional genealogic evidence of a connection between these two men. This Group belongs to a completely different branch of Haplogroup I (see endnote #3 below) that is probably more characteristic of Scandinavia or NW Europe than of Britain—men in this Group may be descendants of Vikings or Anglo Saxon invaders rather than native Britons. We do not have a conventional lineage on the Ewan man (ID).
Comparing the Group Results
The Group Results Tables compare the results of men within each Group to a modal haplotype. Groups 1 & 2 are compared to the Ewing modal haplotype. Group 3 is compared to the R:M222 modal haplotype. Group 4 is compared to the Atlantic Modal Haplotype, which is basically the modal across all men in Western Europe, where Haplogroup R1b1b2 constitutes a large majority. Group 5 is compared to the modal of Group 5a. On the Group 3, 4 & 5 Results Tables, the Ewing modal haplotype is also compared to the reference modal for each Group. To see a comparison of the Groups themselves, or rather a comparison of the Group modals and an explanation of what this means, go to Modal Haplotypes.
Navigating the Results Pages
Go to the website of the Ewing Surname Y-DNA Project at
http://www.ewingfamilyassociation.org/DNA_Project/index_Y-DNA.html, and click on the “Results Directory” link at the top of the page. You can also reach the Results Directory directly by going to
http://www.ewingfamilyassociation.org/DNA_Project/SiteMap_YDNA.html. This will allow you easy access to all of our results pages from one directory, including those for which the links in the pdf version of this document do not work, such as the Network Diagrams and Modal Haplotypes.
|
Old Groups |
New Groups |
|
1 |
1*, 1d, 1e, 1f, 3a, 3b |
|
2 |
5b |
|
3 |
1b |
|
4 |
1a |
|
5 part 1 |
2a |
|
5 part 2 |
2*, 2b, 2c 2d |
|
6 |
4a |
|
7 |
1c |
|
8 |
4*, 4b, 4c |
|
9 |
5a |
[ii] The large group of closely related Ewings constitutes a very distinctive sub-cluster within the M222+ branch of Haplogroup R1b1. What I am calling here M222+ used to be called Haplogroup R1b1c7, and has been associated with the Uí Neill lineage of Northwest Ireland. Detailed discussion of this is rather interesting, but would only be a distraction at this point in the discussion, and is available elsewhere on the website, including a little toward the end of the next endnote.
[iii] [Note that the links to the Network Diagrams in the pdf version of this document do not work. You can reach these from the Results Directory on the website at http://www.ewingfamilyassociation.org/DNA_Project/SiteMap_YDNA.html, or directly by going to http://dl.getdropbox.com/u/431003/NetworkDiagramOverview.pdf and http://dl.getdropbox.com/u/431003/NetworkDiagramDetail.pdf.]
We want to keep technical language in the footnotes of this introductory page, but to understand the diversity of Ewing families, we must speak at least a little of the Y-DNA tree. The Y-DNA tree of all men on planet Earth (http://www.isogg.org/tree/) is subdivided into 18 haplogroups, each named by a letter from A through R. Europe is dominated by Haplogroups R & I, which are account for nearly 80% and 20% of European men, respectively. We have one man in Haplogroup G, five in Haplogroup I and the rest are in Haplogroup R. The common ancestor of Haplogroups R & I lived something like 40,000 years ago, probably in the Middle East. That is quite a long time, and men in these haplogroups are separated by genetic distances on the order of 50. Haplogroup I is thought to have been present in Europe before the last Glacial maximum and perhaps to have originated there. It divided into two main branches about 28,000 years ago; these are separated by genetic distances on the order of 30 to 40. The men in our Group 5a are in one branch, and the man in Group 5b is in the other. Haplogroup R emerged in Central Asia about the same time that the two branches of Haplogroup I split, but we think that it moved into Europe much later—exactly when remains controversial, but it seems to have been after the last Glacial maximum about 10,000 years ago. You can see some hypothesized migration patterns from this time period at https://www.familytreedna.com/y-dna-haplogroup.aspx?kit=26605&ecode=et6hjm3Jpz4%3d. We think that all the Haplogroup R men in our project are actually in one of its branches, R1b1b2, and are separated from one another by genetic distances of up to 20 or so, and had a common ancestor maybe only 6,000 years ago, though this is controversial. The men in our project in Haplogroup R1b1b2 who are not in the M222+ sub-branch comprise our Group 4. The large group of closely related Ewings is in a branch of Haplogroup R1b1b2 once known as R1b1b2e (and before that R1b1c7), but its name changes about every fifteen minutes, and maybe most recently it has been called R:M222 or M222+, after its defining SNP. The common ancestor of this group probably lived 1500 or 2000 years ago; its members are separated by genetic distances of on the order of 10. Our Groups 1, 2 & 3 are in this branch. The closely related group of Ewings is separated by genetic distances of half that much, and their common ancestor probably lived 400 or 500 years ago. Only Groups 1 & 2 are in this cluster.